The EPA has published the results of the HYDROFOR research…
Technical Note: Electrical Conductivity – A useful tool for investigating catchment hydrology.
As environmental hydrology continues to grow in importance, both researchers and practitioners remain on the look-out for investigative techniques to help better understand where aquatic pollutants come from and how they reach water courses. Despite being routinely employed in some disciplines, Specific Electrical Conductance (SEC) remains a relatively underutilised tool for Irish hydrological investigations. This is unfortunate, as the method has been shown to provide a rapid and inexpensive, yet reliable means of measuring water quality in the field, provided certain constraints are taken into consideration. The following short article is the first of two presented in the Catchments Newsletter that examines the utility of SEC for Irish hydrological studies.
Before undertaking SEC surveys, certain technical matters need to be considered to ensure that maximum benefit can be obtained from data collected. Readings are typically taken in the field using a handheld electrical conductivity meter, of which there are many brands on the market of contrasting quality and reliability. In general the maxim “you get what you pay for” applies, with those models at the upper end of the price range typically proving more resistant to instrument drift. However, regardless of what meter is employed, routine calibration is essential. This should typically be done at least once a day, using standards having SECs approaching those anticipated in a survey area; it is generally considered good practice to calibrate immediately before and immediately after a survey each day to ensure instrument reliability.
Once the above precautions are considered, measurements in the field can provide a valuable insight into hydrological processes, particularly when data are collected in a catchment under contrasting hydrological regimes and/or at different times of the year. However, as electrical conductivity is temperature dependent, variations in how warm (or cold) different water samples are need to be accounted for; this is achieved by standardising all measurements to 25 degrees C to give Specific Electrical Conductance (SEC). Note that not all models of conductivity meter provide an SEC readout, under these circumstances temperature must be recorded and corrections to yield SEC retrospectively applied. Indeed, even where SEC is provided, it is generally considered good practice to measure temperature, as it can provide valuable supplemental information about hydrological processes, such as the location of upwelling groundwater.
In the natural environment the SEC of water can vary enormously, from values around 5 microsiemens per cm (mS/cm) encountered in some rainwater samples, to levels one million times higher in saline waters. In unpolluted freshwater systems, SEC reflects the presence of substances present in the soils, subsoils and bedrock that water encounters along hydrological flow paths which form ions when dissolved. These can vary dramatically from one geological setting to another. For geological units typically encountered in Ireland, SECs can range from 10s of mS/cm in water samples collected from poorly decomposed raised bog peats to values over an order of magnitude higher in samples collected from units such as calcareous subsoils and carbonate bedrock. (Natural SECs above 1000mS/cm are rare in Irish freshwaters).
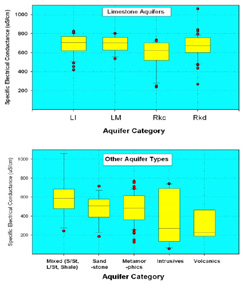
Box and whisker plots contained in Figure 1 summarise the SEC of bedrock groundwater samples contained in the EPA’s Groundwater Quality Monitoring Database. The plots provide an idea of anticipated ranges for each aquifer type and demonstrate more consistent median SECs in limestone aquifers, compared to non-carbonate and mixed aquifer types. The slightly lower median SEC and greater range of variation observed in non-carbonate aquifers partially reflects the influence of geochemistry. These aquifers are typically less reactive than limestones, giving lower SECs. However, their signature may be overprinted by carbonates present in the overburden, which then dominate ionic content in underlying aquifers, particularly in units with short residence times. In all aquifer types the range of variation remains relatively high. Given the level of variation observed, direct measurements of groundwater SEC in a catchment should be sought out to build confidence in interpreting catchment-specific data and the role of different hydrological flow paths
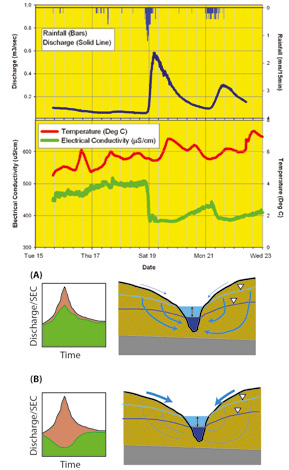
At the catchment scale, where significant geochemical differences exist along various hydrological flow paths, SEC measurements can act as a useful screening tool for constraining potential processes. Mapping the results of these measurements across a catchment allows us to examine spatial variations in water quality and attribute responses observed to processes operating within subcatchments. Alternatively, use of automated SEC loggers permits large numbers of measurements to be collected in time at fixed points and thus provide a means of characterising (integrated) temporal variations in water quality (Figure 2).
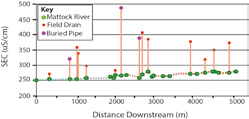
SEC can also prove useful in detecting pollution, particularly where high concentrations of ions are present in source effluent, examples of which include landfill leachate, septic tank effluent and some agricultural wastes. In many cases the conductivities of these liquids prove significantly greater than background levels, thus permitting SEC to be employed as a screening tool for targeting samples for laboratory analyses. At the same time, examining trends in SEC levels along water courses allows us to identify potential sources of surface water pollution and the relative contributions they make to total pollutant load (See Figure 3 and Figure 4).
While measuring SEC can prove a very valuable investigative tool, it is essential that data be interpreted while considering catchment land use and physical setting. What’s more, there can often be considerable temptation to relate SEC to the concentration of specific pollutant concentrations. Although this may be appropriate, one needs to remember that not all ions (even at equivalent concentrations,) will generate the same SEC response. Consequently, SEC should be used, and compared to the results of laboratory based analyses to establish links (if any) with pollutant levels. As a corollary to this point, samples that do not have SECs differing significantly from pristine waters may still be polluted since many pollutants are not ionic and thus do not contribute to measured SEC responses. Furthermore, some pollutants, although ionic, may impact water quality at concentrations below levels that permit them to be confidently measured using field SEC meters. Finally, when interpreting results remember that profiling provides a snapshot of conditions and that water quality varies depending on hydrological processes operating at the time of measurement.
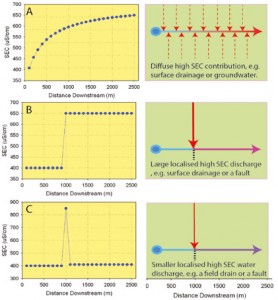
A. Lower SEC stream (400 mS/cm) receiving sustained inputs of 700mS/cm water (1m3/ sec/100m).
B. Input of 700mS/cm water (and doubling of discharge) between 900m and 100mm downstream.
C. Response observed with an equivalent increase in SEC but with a flow increase of 0.1m3/sec over the same interval; the spike in the data (not simulated) reflects incomplete mixing of waters.
Despite these limitations, SEC can prove a very useful investigative tool for environmental hydrologists. Maximum benefit can be obtained by combining its use with other routinely measured parameters, including with the results of laboratory water quality analyses, and with physical hydrological data. Moreover, repeated measurements of SEC in the same catchment, particularly during periods of contrasting hydrological conditions, build confidence in interpreting survey results. Although still relatively underutilised in Ireland, continuous monitoring of SEC with discharge during the recently completed EPA-funded Pathways Project demonstrated the value of the parameter for distinguishing between potential hydrological delivery mechanisms. SEC surveying deserves further consideration as an investigative technique in the Environmental Hydrologists tool kit. Experience to date across Ireland suggest that it can act as an useful method in helping identify pollution sources and characterising the pathways by contaminants can reach surface water receptors. This in turn can assist decision makers on taking suitable courses of action to maintain environmental quality.
Article by Raymond Flynn, Queen’s University Belfast, and Jenny Deakin, EPA Catchments Unit.
